The new Police powers procedures dataset (published 26 September 2023, updated March 2024) showed little year-on-year change in stop and search activity at both the aggregate and localised levels. Instead, there was more to gleam from the presentation of the data than the data itself.
There was a small rise in overall searches conducted by the police in the year to 31 March 2023: forces made 547,003 searches, 3% up on the previous year (530,970). This change was driven mostly by the number of searches under legislation associated with section 1 of the Police and Crime Evidence Act 1984 (PACE), which rose from 526,629 to 542,723 (categories 'criminal damage' and 'going equipped'). Drugs remained the most common reason for searches (61% of searches) despite a decrease of four percentage points compared with the year to March 2022. Offensive weapons (16%) remained a distant second proportionally of section 1 PACE searches (and associated legislation).
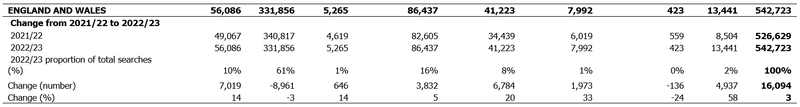
Of those 542,723 searches under section 1 PACE (and associated legislation), 73,891 led to an arrest, 10% higher than the year ending March 2022. The proportion of searches resulting in an arrest increased by a single percentage point (from 13% to 14%).
There was little change in the volume of section 60 Criminal Justice and Public Order Act 1994 searches: police in England and Wales carried out 4,280 stop and searches under the power, -1% compared with the year ending March 2022 (when 4,341 such searches were undertaken). This also represents the third consecutive decrease in the number of searches under section 60, following 3 years of increases between the year ending March 2018 and the year ending March 2020.
The use of section 60 was also more widespread compared with the year to March 2022, as the number of forces in England and Wales making at least one stop and search under section 60 powers increased from 18 to 23.
Greater Manchester Police (GMP) overtook the Metropolitan Police Service (MPS) in the number of stop and searches conducted under section 60 CJPOA, accounting for 22% of the England and Wales total, compared with 17% by MPS.
5% of section 60 searches resulted in an arrest in the year ending March 2023, up from the year ending March 2022 (3%).
Outcomes
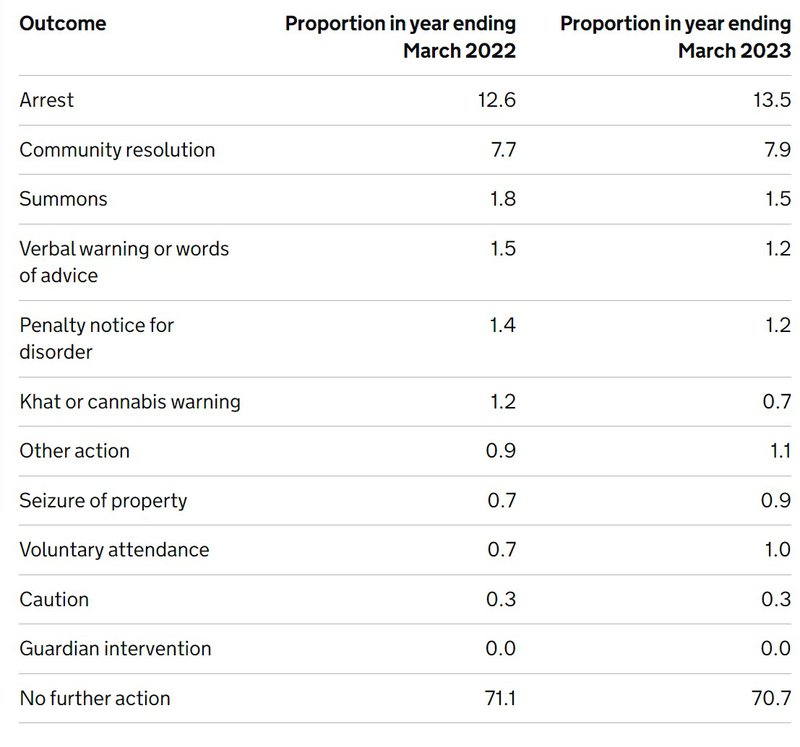
In roughly 71% of stop and searches, the outcome was recorded as needing ‘no further action’, similar to recent years past.
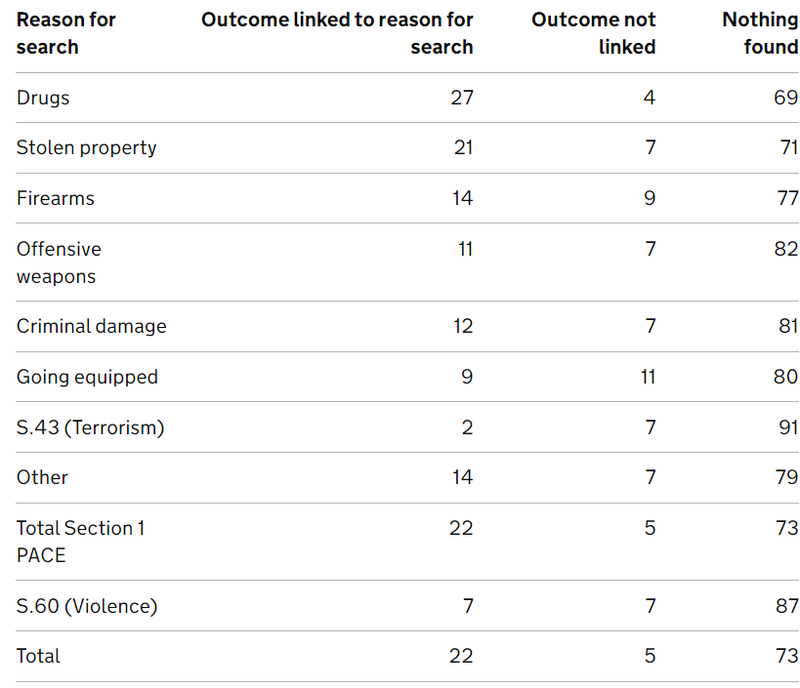
The same was the case for the link between the reason for searches and eventual outcomes: in the year ending March 2023, 22% of stop and searches resulted in an outcome that was linked to the reason for the search, similar to the previous year (23%).
Stopping violence with a 'silver bullet'
As a tactic claimed by police to reduce violent crime, the capture of dangerous weapons represents a small proportion of searches: roughly 3% (15,087) of all searches resulted in an offensive weapon or firearm being found.
The role of stop and search in tackling violence to reflect the racial disproportionality of searches does not appear to be borne out in finds from those searches. Across all ethnicities, roughly between 2% and 4% of stop-searches found weapons on individuals searched. In terms of volume, white people were most often found with weapons.
Use of force
Among the many datasets added to this year's release was over whether force was used during a stop and search. 22 of 44 police forces provided this data voluntarily, accounting for 70% (383,460) of the total number of stop and searches in the year ending March 2023.
The Home Office found that by police forces' own records, use of force was employed in 28% of all searches conducted in England and Wales in the year to 31 March 2023 (108,633 of 383,460 searches where the information as available). Of the forces that submitted records, the Metropolitan Police Service had the highest number (63,606 out of 177,490) and proportion (36%) of searches in which force was used, followed by Thames Valley Police and Hertfordshire Constabulary at 35%, and Cambridgeshire Constabulary at 34%.
These figures should be approached with caution as it is important to note that, as is stated by College of Policing Authorised Professional Practice, the physical act of searching a person is itself a use of force, 'even if it does not involve any element of restraint or physical compulsion'.
Disappearing disparities
Similar to the headline figures, there was little change in the ethnic disparity of searches. Compared with white people:
- Black people were searched x4.1 more often (down from x4.8)*
- Asian x1.4 (down from x1.6)
- Mixed x1.7 (no change)
- Other ethnic groups x1.3 (up from x1.2)
The most notable development was the defence made for the fact that disparity rates are highest for individuals from a Black or Black British background, compared with white people. The text reads that 'these differences do not account for different likelihoods of being either a suspect or a victim of crime', but even when accounting for arrests (persons who identified as Black were arrested at a rate 2.1 times higher than those who identified themselves as white) the intensity of searches on Black people does not appear to match the level of arrests made on people who identify with that ethnic group. It is also important to note that none of these figures can adequately explain the outcome of 'no further action' in seven out of every ten arrests in England and Wales every year.
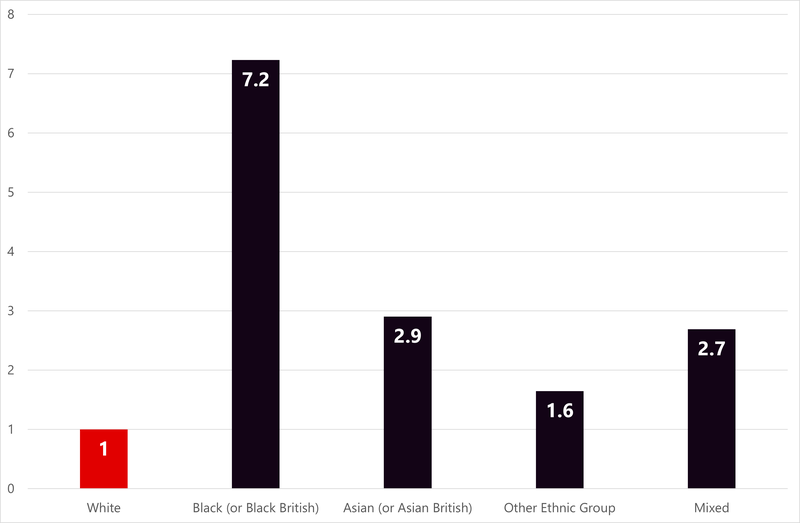
When looking at ethnic disparity rates in searches conducted under the suspicionless section 60 power, compared with white people:
- Black people were searched x7.2 more often
- Asian x2.9
- Mixed x2.7
- Other ethnic groups x1.6
Along with several other 'interpret this data with caution' caveats, the Home Office is keen to make its readers mindful of the fact that when interpreting stop and search data calculated using population figures, 'the population data is based on residential estimates and does not show the transient population – people who move into and out of an area, but do not live there'. New hotspot policing data reveals a consistent pattern amongst forces most frequently using the tactic, where 'about half of stop and search takes place in 6% to 10% of Lower Super Output Areas (LSOA)'.
However, as we noted in our Colour of injustice report when looking at the example of London as a major driver of ethnic disparities in stop and search, the issue of 'race' confounds geographic assessments of stop and search activity. While stop and search is associated with deprivation and inequality, disproportionality is associated with wealth and affluence.
Our report found that high rates of stop and search disproportionality were evident in both inner and outer London, and that affluent areas are characterised by very low rates of stop and search for white people and high rates of Black / white disproportionality, a pattern 'consistent with ethnic profiling because it indicates that Black people are singled out for suspicion'. We have little reason to believe that the nature of 'transient populations' changes this.
For a summary of the data, please find our thread on Twitter.
* this is based on the so-called 'old measure' of self-defined ethnicity. This misses out roughly 20% of recorded searches on the basis that the ethnicity is not stated. The Home Office have devised an alternative measure substituting in officer-defined ethnicity of individuals to fill the gaps. Many of the ethnic disparity figures are wider as a result